Created: 11.12.2024
Check audio quality like a PRO
Only a handful of people in the world posses an absolute pitch often called perfect pitch (not to be confused with Pitch Perfect). These people can flawlessly recognize changes in audio quality. Average listeners (like Myself) though, may experience slight swings in sound quality at best subjectively. However, if one listens to something, one should listen to it in the best possible quality. In this tutorial, I’ll show You how to objectively test whether setting a higher quality on a given audio service provider actually increases the sound quality. Be no longer be condemned to believe what is written in the properties.
blast of theory 💥
- Most of the audio that reaches the receiver through the digital world is processed through lossy compression.
- The losses that this compression causes are irreversible, however, with the right settings they can be minimized.
- Through the use of brilliant algorithms 1 and charts 2, it is possible to represent sound in graphical form.
- It is easier to identify details of information that audio signal carries in graphical form than in sound form.
- One of the best ways to see quality of sound is through comparison.
steps
1. Install software that can record audio
I strongly suggest Audacity. Installation link: https://www.audacityteam.org/.
2. Recording desktop audio at different settings
How to record with audacity?
The developers of Audacity have created a short note on how to do it on each of the Windows/Linux /macOS computer operating systems. https://support.audacityteam.org/basics/recording-desktop-audio.
Chose audio that is a good benchmark.
You’ll do best, if you look for a recording known as white noise 3 in the service of your choosing. White noise is a random sound signal with the unique characteristic that its intensity 4 is equal at different frequencies 4. This characteristic makes it easy to see quality losses on graphical form of noise sound, especially when the quality settings are set to low in loose compression.
It is important to note, that if You want to export recorded samples, You shall do it in format that is compressed by lossless compression like WAV.
I picked one white noise on YouTube: https://youtu.be/IMRj1ombxqY?si=Kbbeb_fpGwVeGz4d, then I recorded samples at the best available quality and the worst and save them as .wav files.
I found one on Spotify also: https://open.spotify.com/track/5Ogu8Uuy3xeOxsauuCVRk1?si=ded22cff811a4830, changed quality in settings, cleared cache and did recording. As with YouTube, I saved the recordings in .wav files.

3. Change view to spectrogram
By default, Audacity shows the waveform view of audio track. The waveform shows amplitude (the energy of audio signal that we subjectively interpret as loudness 🔊) over time, but overall We can’t really see what’s happening at individual frequencies.
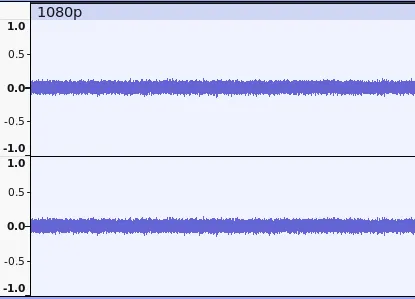 waveform view
Spectrogram allows seeing intensity of sound frequencies and how they vary in time. In the spectrogram view, the vertical ↕️ axis displays frequency in Hertz (what we perceive as a pitch), the horizontal axis ↔️ represents time (just like the waveform display), and amplitude is represented by brightness 🌟.
Depending on color scheme, black background or white is silence, the presence of color signifies the occurrence of frequency, the intensity and hue reflect the amplitude of a particular frequency at a given point in time. In example below, blue 🟦 means low amplitude and red 🟥 high, like with temperature cold and hot.
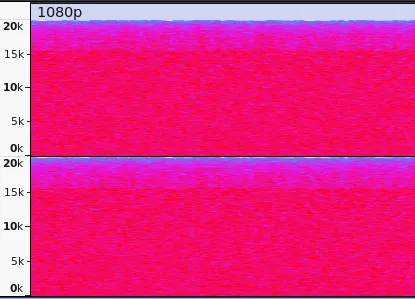 spectrogram view
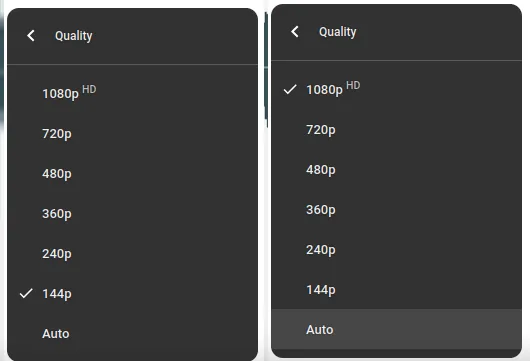
To change view from waveform view into spectrogram view right-click on left side of the track box area, and select Spectrogram in context menu.
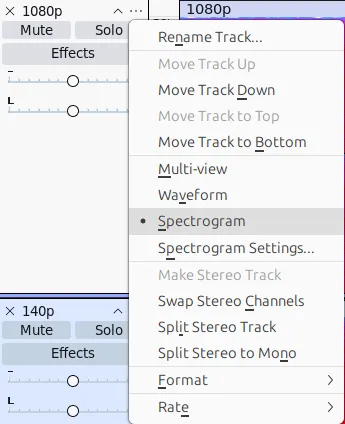 spectrogram change context menu
4. What to look for?
The analysis of digital signals in this case can be reduced to dot analysis. The more dots can be seen and the more smoothly they change color, the more detail the recorded audio has. In case of white noise spectrogram analysis, we want to see a whole box full field with color.
Spotify case
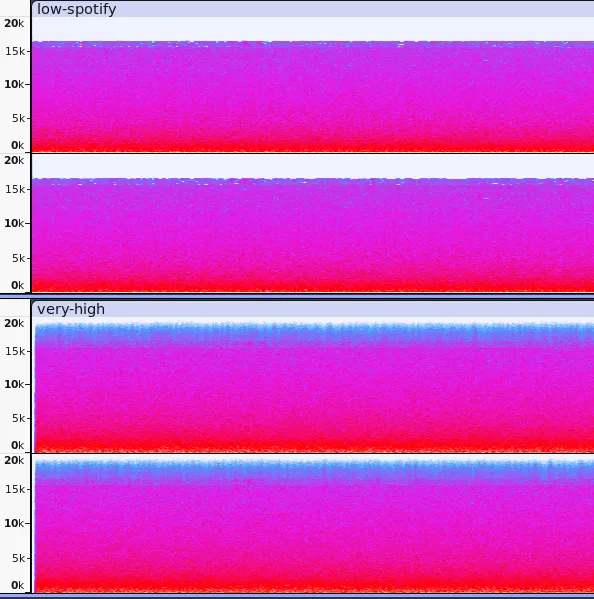 Observing the spectrograms of Spotify’s white noise recordings, one can see the loss of color in the case of low-quality streaming. This loss is found at the top, in the area that represents the higher tones.
Zooming in 🔍️ only on the top view, the difference between the recordings becomes most apparent.
Observing the spectrograms of Spotify’s white noise recordings, one can see the loss of color in the case of low-quality streaming. This loss is found at the top, in the area that represents the higher tones.
Zooming in 🔍️ only on the top view, the difference between the recordings becomes most apparent.
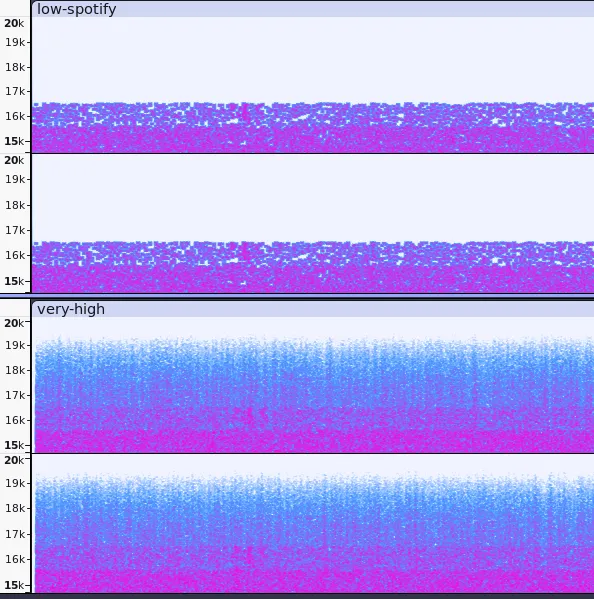 A low-quality recording has no sounds above about 16.5 kHz (white color), and recordings below the limiting frequency have less detail (large dots, no smoothness of color change between dots).
This is a result that was to be expected as much as possible.5
YouTube case
YouTube’s recordings are not so obvious. The 1080p and 144p spectrograms look identical in both full and close-up views.
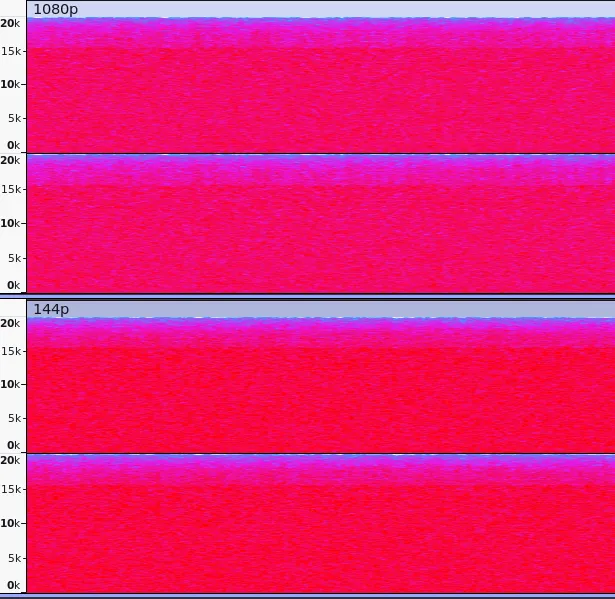 It is impossible to notice the lack of recorded frequencies or less detail in the higher areas. It can be assumed that YouTube does not reduce audio quality.
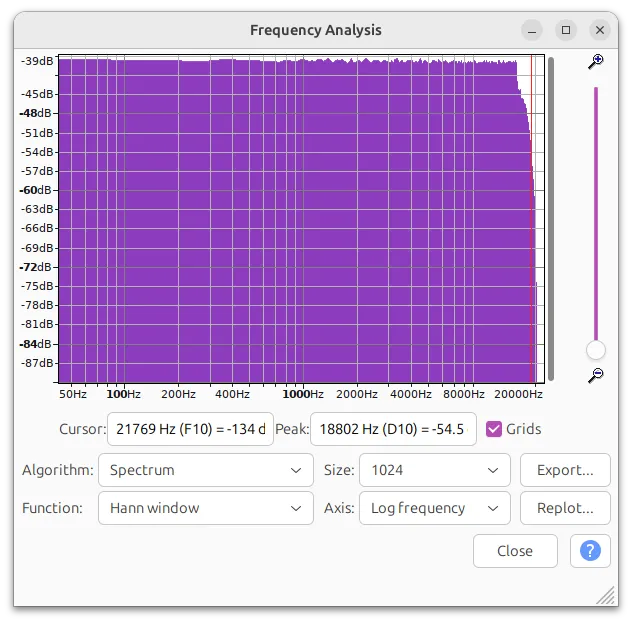
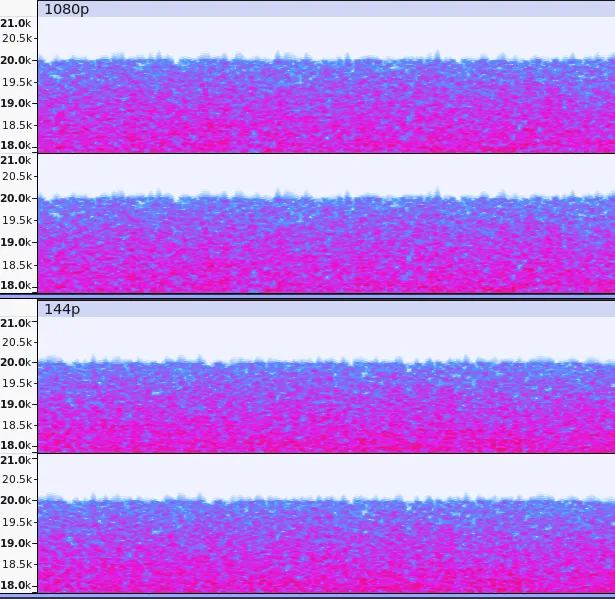 To confirm this, one can look at the intensity of the frequencies throughout the audio track. To do this, we need to plot a spectrum.
The unique characteristic of white noise, which is equal intensity at different frequencies, will result in the drawn graph being a flat line.
 1080p spectrum
And that’s exactly what we get in both recorded YouTube samples.
 144p spectrum
Such charts leave us convinced that YouTube does not lower the sound quality as the video quality decreases. It is safe to set the lowest resolution on YT for listening purposes only.
Additional resources:
- https://www.izotope.com/en/learn/understanding-spectrograms.html
- https://youtu.be/SAp82nq-uKw?si=tuSksMCoQ6ba_xO1
- https://youtu.be/OekQBS3V6Kc?si=qIwSCCFbLmlZD_SL
Footnotes
-
The best-known of these algorithms are the Fast Fourier Transform (FFT), the Discrete Cosine Transform (DCT) and the Discrete Wavelet Transform (DWT). Thankfully, it is not necessary to understand how they work to use them. https://en.wikipedia.org/wiki/Fast_Fourier_transform ↩
-
Charts allow human being to interpret raw data. Not everyone is an accountant and can see that something deviates from the norm by looking at the numbers alone. ↩
-
Noises are a group of signals that are random and unordered, and foremost very interesting. White noise is not the only one, there are many others like pink noise or brown noise. Some of these noises can be pleasant for humans and increase ability to focus or calm down. https://en.wikipedia.org/wiki/White_noise, https://www.verywellmind.com/exploring-the-potential-of-pink-and-brown-noise-for-neurodivergent-individuals-6751354 ↩
-
This tutorial has brief explanations to required terms, do not worry physics. In fact If You want to go deeper with acoustics or signals therefore waves, there is a high quality resource: https://openstax.org/subjects/science#Physics ↩ ↩2
-
Lossy compression uses various tricks to ensure that the listener does not experience a significant loss of sound. The human sense of hearing is less sensitive to sounds above 10kHz and can hardly hear sounds above 20kHz at all. It was a clever and textbook move to remove this data to reduce size of audio. ↩
Author: MtGr